All credit for this text goes to...
Ragan, C. T. S. (2024). Macroeconomics (18th Canadian ed.). Pearson Canada.
List the factors that determine the quantity demanded of a good
What is quantity demanded?
Quantity demanded = desired purchases at a given price, per time period
Quantity demanded is the amount of a product consumers want to purchase at a given price during a specific time period.
Key distinctions
Desired vs. actual — Quantity demanded is desired purchases, not necessarily actual purchases. If supply is constrained, quantity demanded may exceed quantity purchased/exchanged.
Example
You try to buy a plane ticket for reading week, but all flights are sold out.
- Quantity demanded: 1 ticket (what you wanted)
- Quantity purchased: 0 tickets (what you got)
Flow vs. stock — Quantity demanded is a flow variable — meaningless without a time period.
Flow = "per time" — Stock = "right now"
| Variable Type | Question Answered | Example |
|---|---|---|
| Stock | How much exists now? | Water in bathtub (100L) |
| Flow | How much per time period? | Water from tap (10L/min) |
The Trap
You cannot add a stock to a flow without specifying duration.
100L + 10L/min = ???
Until you know how long the tap runs, the addition is meaningless.
Example
“50,000 cars demanded in Canada” — Is this good or bad?
- 50,000 per day = enormous demand
- 50,000 per year = tiny demand
The number means nothing without the time period.
What is demand?
Demand = the entire price-quantity relationship (the whole curve)
Demand is the entire relationship between price and quantity demanded across all possible prices. Represented by the whole demand curve, not a single point.
What is a demand schedule?
A table showing quantity demanded at each price
A table showing quantity demanded at various prices, ceteris paribus.
| Price ($) | Quantity Demanded (units/week) |
|---|---|
| 5 | 10 |
| 4 | 20 |
| 3 | 35 |
| 2 | 55 |
| 1 | 80 |
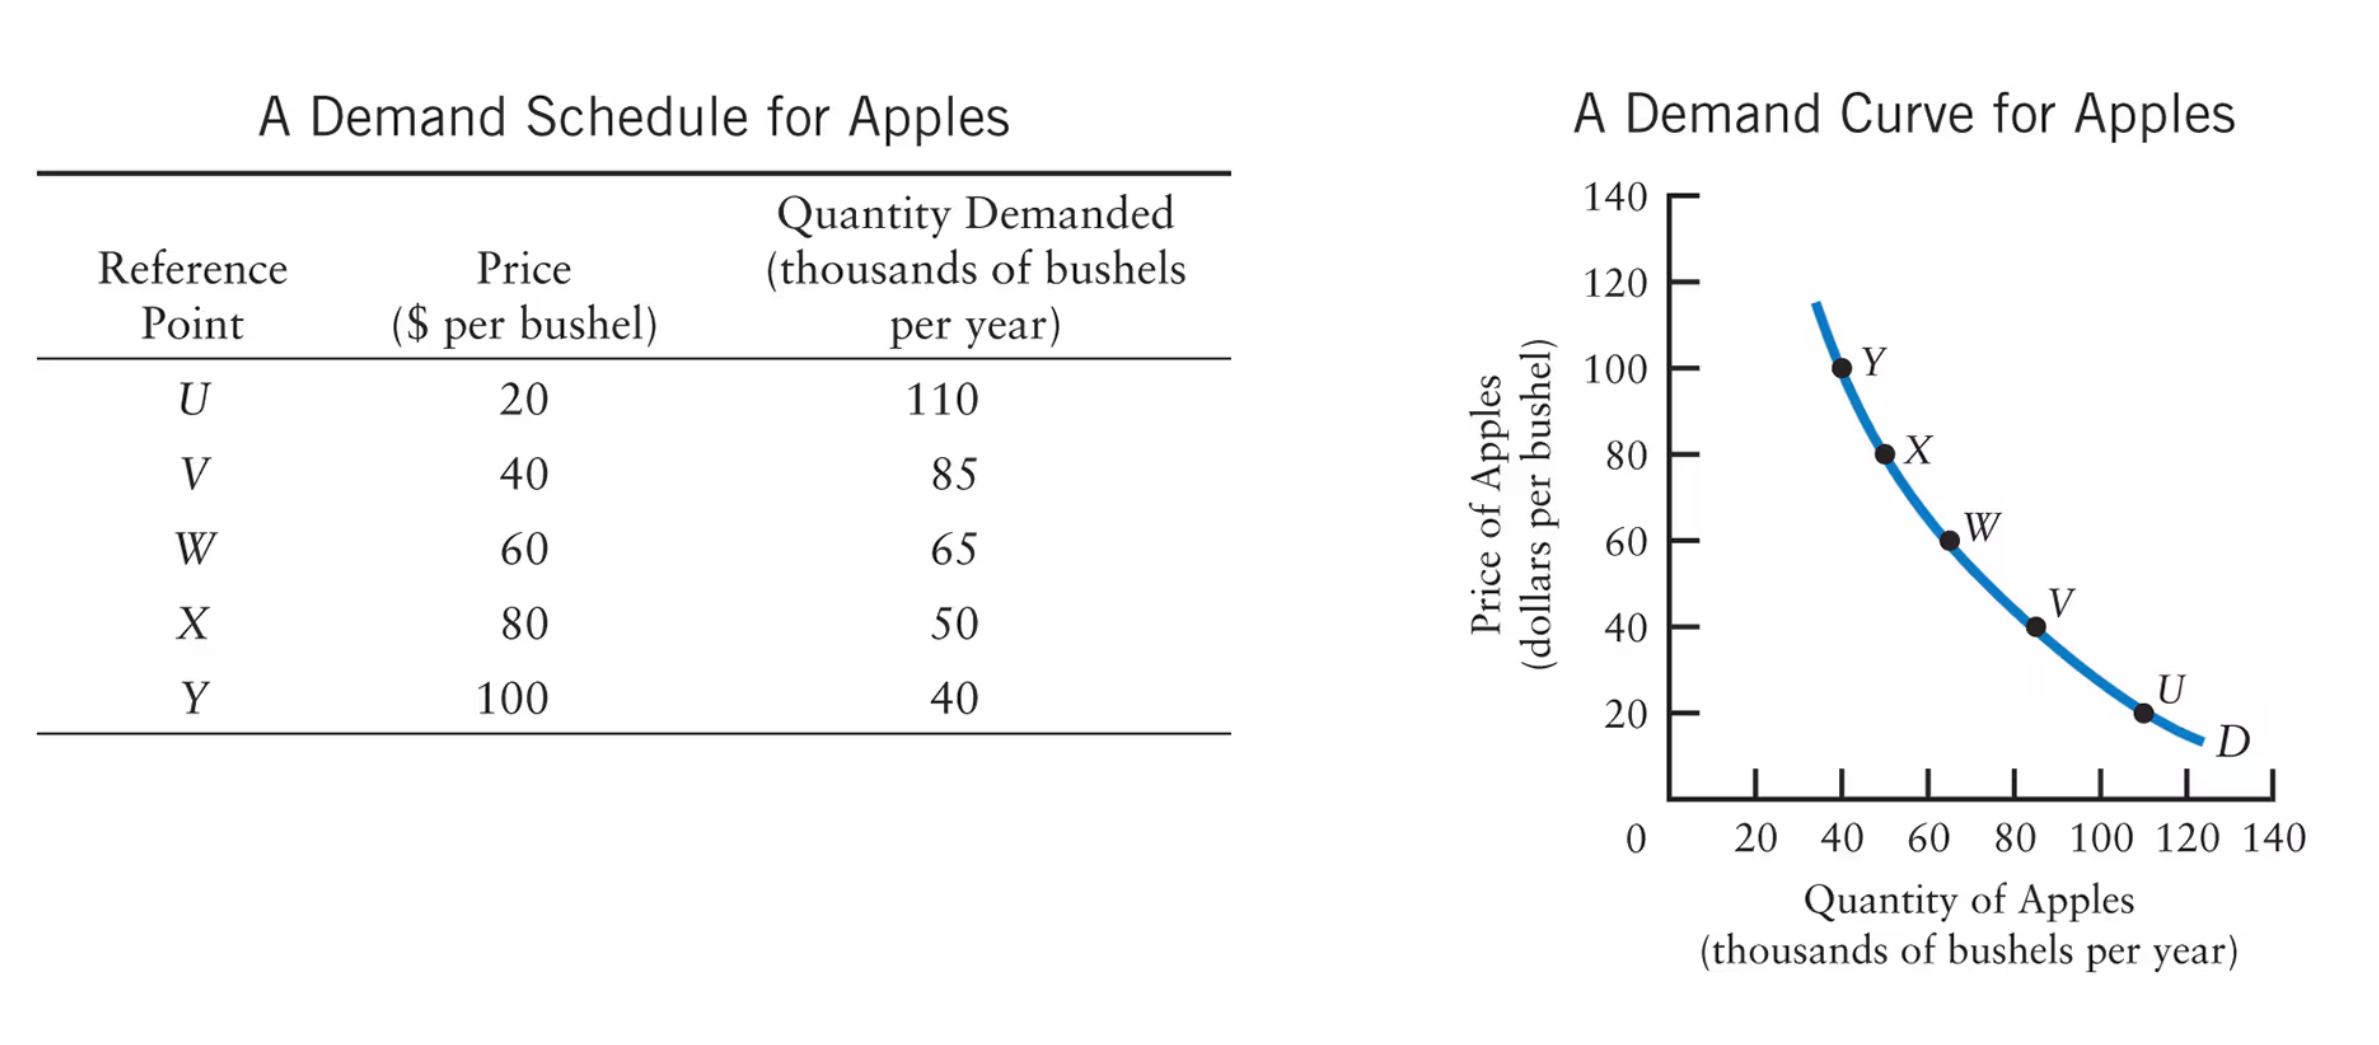 |
What is a demand curve?
A graph of the demand schedule — price on Y-axis, quantity on X-axis
The graphical representation of the same relationship. Price on vertical axis, quantity on horizontal axis.
left=0; right=100; bottom=0; top=7;
---
y = 6 - 0.0625x | blue | label: Demand
Attention
Each point = quantity demanded (at that price)
The entire curve = demand
Why does the demand curve slope downward?
Price ↑ = Quantity Demanded ↓ (Law of Demand)
The Law of Demand, formulated by Alfred Marshall: price and quantity demanded are negatively related, ceteris paribus.
- Price ↑ → Quantity demanded ↓
- Price ↓ → Quantity demanded ↑
The mechanisms
Two reasons: substitution effect + income effect
Substitution effect — As price rises, the product becomes expensive relative to alternatives. Consumers switch to substitutes.
Income effect — As price falls, purchasing power effectively increases. Consumers can afford more.
Example
Meat prices rise:
- Substitution: Some consumers switch to vegetables or meat substitutes
- Income: The same budget now buys less meat, so they buy less
Both effects push quantity demanded downward.
What factors determine quantity demanded?
Own price (along the curve) + 6 shifters (move the whole curve)
The 1 + 6 structure
| Category | Factor | Effect on Curve |
|---|---|---|
| On the axis | Own price | Movement along the curve |
| Shifters | Everything else | Shifts the entire curve |
The 6 shifters (3-2-1)
Money (3) + People (2) + Wild card (1)
Money factors:
| Factor | Direction of Effect |
|---|---|
| Consumer income ↑ | Demand ↑ for normal goods; Demand ↓ for inferior goods |
| Price of substitutes ↑ | Demand ↑ (switch toward this good) |
| Price of complements ↑ | Demand ↓ (use them together, so buy less of both) |
People factors:
| Factor | Direction of Effect |
|---|---|
| Preferences shift toward good | Demand ↑ |
| Population ↑ | Demand ↑ |
Wild card:
| Factor | Direction of Effect |
|---|---|
| Weather | Varies — cold snap ↑ demand for heating; snow ↑ demand for ski trips |
How do we classify goods?
By income response
Idea
Normal good: income ↑ → demand ↑
Inferior good: income ↑ → demand ↓
| Type | When Income ↑ | Example |
|---|---|---|
| Normal good | Quantity demanded ↑ | Restaurant meals |
| Inferior good | Quantity demanded ↓ | Instant noodles, public transit |
Example
Your income rises. You:
- Eat out more (restaurants = normal good)
- Take fewer buses, more taxis (public transit = inferior good for you)
By relationship to other goods
Substitutes compete; Complements combine
| Type | Definition | Example |
|---|---|---|
| Substitutes | Satisfy similar needs; compete | Butter and margarine |
| Complements | Used together | Cars and gasoline |
Example
Substitutes: Price of butter ↑ → Demand for margarine ↑ (people switch)
Complements: Price of flights to Calgary ↑ → Demand for Banff ski passes ↓ (used together)
What is the difference between movement along vs. shift of the demand curve?
Idea
Own price → move along.
Anything else → shift the whole curve
| Change | Caused By | What Moves |
|---|---|---|
| Change in quantity demanded | Own price changes | Movement along existing curve |
| Change in demand | Any of the 6 shifters | Entire curve shifts left or right |
What is movement along the demand curve and what causes it?
Movement along = change in Quantity Demanded
Caused by own price changing
When the product’s own price changes, you move along the existing curve to a new point. The curve itself doesn’t move.
- Price ↑ → move up and left along curve → quantity demanded ↓
- Price ↓ → move down and right along curve → quantity demanded ↑
What is a shift in the demand curve and what causes it?
Shift = change in Demand
Caused by any of the 6 shifters (not own price)
When any factor other than own price changes, the entire curve moves to a new position.
Demand increases (curve shifts right) — More quantity demanded at every price
Demand decreases (curve shifts left) — Less quantity demanded at every price
The 6 shifters that cause shifts:
- Consumer income
- Price of other goods
- Price of substitutes
- Price of complements
- Consumer preferences
- Population
- Weather
Example
The Coffee Paradox News “Rising demand for coffee has increased prices” News story 2: “Rising coffee prices are reducing purchases”
Both are true:
- Population/income growth shifted demand curve right → prices rose
- Higher price caused movement up and left along the new curve → quantity demanded fell
First is a shift. Second is a movement along.
List the factors that determine the quantity supplied of a good
What is quantity supplied?
Quantity supplied = desired sales at a given price, per time period
Quantity supplied is the amount of a product producers want to sell at a given price during a specific time period.
Key distinctions
Desired vs. actual — Quantity supplied is desired sales, not necessarily actual sales. If demand is weak, quantity supplied may exceed quantity sold/exchanged.
| Term | Meaning |
|---|---|
| Quantity supplied | What producers want to sell |
| Quantity sold/exchanged | What they actually sell |
The Trap
Don’t confuse quantity supplied with quantity produced.
A firm might produce 100 units but only sell 80 — the other 20 sit in inventory. Production and sales can diverge.
Flow vs. stock — Quantity supplied is a flow variable — meaningless without a time period.
Example
“500 cars supplied” — Is this a lot?
- 500 per day = substantial supply
- 500 per year = tiny supply
The number means nothing without the time period.
What is supply?
Supply = the entire price-quantity relationship (the whole curve)
Supply is the entire relationship between price and quantity supplied across all possible prices. Represented by the whole supply curve, not a single point.
What is a supply schedule?
A table showing quantity supplied at each price
A table showing quantity supplied at various prices, ceteris paribus.
| Price ($) | Quantity Supplied (units/week) |
|---|---|
| 1 | 10 |
| 2 | 25 |
| 3 | 40 |
| 4 | 55 |
| 5 | 70 |
What is a supply curve?
A graph of the supply schedule — price on Y-axis, quantity on X-axis — slopes UPWARD
The graphical representation of the same relationship. Price on vertical axis, quantity on horizontal axis.
left=0; right=100; bottom=0; top=7;
---
y = 0.8 + 0.06x | red | label: Supply
Key distinction from demand
- Demand curve slopes downward (negative relationship)
- Supply curve slopes upward (positive relationship)
Higher price → producers want to supply MORE (not less)
Why does the supply curve slope upward?
Higher price → more profit per unit → worth producing more
The mechanism is profitability.
- Higher price → more profit per unit sold
- More profit → worth producing units that weren’t profitable before
- Also → attracts new firms who couldn’t profit at lower prices
From the textbook
“Any event that makes production of a specific product more profitable will lead firms to supply more of it.”
| Side | Slope | Core driver |
|---|---|---|
| Demand (downward) | Price ↑ → Quantity demanded ↓ | Consumer satisfaction per dollar |
| Supply (upward) | Price ↑ → Quantity supplied ↑ | Producer profit per unit |
Demand asks: “Is this worth buying?” Supply asks: “Is this worth making?”
What factors determine quantity supplied?
Own price (along the curve) + 7 shifters (move the whole curve)
All 7 shifters tie back to PROFITABILITY
The 1 + 7 structure
| Category | Factor | Effect on Curve |
|---|---|---|
| On the axis | Own price | Movement along the curve |
| Shifters | Everything else | Shifts the entire curve |
The 7 shifters (3-3-1)
Costs (3) + Market (3) + Wild card (1)
Cost factors:
| Factor | Direction of Effect | Mechanism |
|---|---|---|
| Input prices ↑ | Supply ↓ (shifts left) | Costs ↑ → profit ↓ |
| Technology improves | Supply ↑ (shifts right) | Costs ↓ → profit ↑ |
| Tax ↑ | Supply ↓ (shifts left) | Costs ↑ → profit ↓ |
| Subsidy ↑ | Supply ↑ (shifts right) | Revenue ↑ → profit ↑ |
Technology connects to short run, long run, and very long run
This will be explored later — technology affects efficiency, productivity, cost per unit, and market entry over different time horizons.
Market factors:
| Factor | Direction of Effect | Mechanism |
|---|---|---|
| Price of substitute in production ↓ | Supply ↑ (shifts right) | Other product less profitable → switch to this one |
| Price of complement in production ↑ | Supply ↑ (shifts right) | Produce more of main product → byproduct supply rises |
| Number of suppliers ↑ | Supply ↑ (shifts right) | More firms producing → more total output |
What are substitutes and complements in production?
Idea
Substitutes = make one OR the other Complements = make one AND get the other
| Type | Logic | Example |
|---|---|---|
| Substitutes in production | Same resources, choose which to make | Wheat/oats (same field), volleyballs/soccer balls (same factory) |
| Complements in production | One product creates the other as byproduct | Beef and leather (slaughter cattle → get both) |
Substitutes in production
A farmer can plant wheat or oats in the same field.
- Price of oats ↓ → oats less profitable → farmer plants more wheat
- Supply of wheat shifts right (even though wheat’s price didn’t change)
Complements in production
Cattle produce both beef and leather.
- Price of beef ↑ → more cattle slaughtered → more leather produced
- Supply of leather shifts right (even though leather’s price didn’t change)
Wild card:
| Factor | Direction of Effect | Mechanism |
|---|---|---|
| Good weather | Supply ↑ (shifts right) | Better yields, fewer disruptions |
| Bad weather | Supply ↓ (shifts left) | Damaged crops, disrupted production |
Weather impacts
- Drought devastates wheat crop → supply shifts left
- Hurricane damages factory → supply shifts left
- Perfect growing season → supply shifts right
Distinguish between a shift of the supply curve and a movement along the supply curve
What is the difference between movement along vs. shift of the supply curve?
Idea
Own price → move along Anything else (the 7 shifters) → shift the whole curve
| Change | Caused By | What Moves |
|---|---|---|
| Change in quantity supplied | Own price changes | Movement along existing curve |
| Change in supply | Any of the 7 shifters | Entire curve shifts left or right |
What is movement along the supply curve and what causes it?
Movement along = change in quantity supplied
Caused by own price changing
When the product’s own price changes, you move along the existing curve to a new point. The curve itself doesn’t move.
- Price ↑ → move up and right along curve → quantity supplied ↑
- Price ↓ → move down and left along curve → quantity supplied ↓
What is a shift in the supply curve and what causes it?
Shift = change in supply
Caused by any of the 7 shifters (not own price)
When any factor other than own price changes, the entire curve moves to a new position.
Supply increases (curve shifts right) — More quantity supplied at every price
Supply decreases (curve shifts left) — Less quantity supplied at every price
The 7 shifters that cause shifts:
- Input prices
- Technology
- Taxes/subsidies
- Price of other products
- Price of substitutes in production
- Price of complements in production
- Number of suppliers
- Weather
Tracing a supply shift
New technology reduces production costs for smartphones:
- Technology improves → cost per unit ↓
- Lower costs → profit per unit ↑ at every price
- Higher profit → firms willing to supply more at every price
- Supply curve shifts right
Why do people often mistake a change in demand/supply and a change in quantity demanded/supplied?
The vocabulary sounds similar, but one is a SHIFT and one is a MOVEMENT
| Term | What It Means | What Causes It |
|---|---|---|
| Change in demand/supply | Whole curve shifts | External factors (the shifters) |
| Change in quantity demanded/supplied | Movement along curve | Own price changes |
The clear way to distinguish them
Ask: "Did the PRICE of THIS PRODUCT change, or did something ELSE change?"
| If… | Then… | Example |
|---|---|---|
| Own price changed | Movement along (quantity changes) | Coffee price ↑ → quantity demanded ↓ |
| Something else changed | Shift of curve (demand/supply changes) | Income ↑ → demand for coffee shifts right |
The Trap
News headlines blur these constantly:
- “Rising demand increases prices” (shift caused price change)
- “Rising prices reduce demand” (should say “reduce quantity demanded”)
The second headline is technically wrong — rising prices cause movement along, not a shift of demand.
The Coffee Paradox (Demand version)
Story 1: “Rising demand for coffee has increased prices” Story 2: “Rising coffee prices are reducing purchases”
Both are true:
- Income/population growth → demand shifts right → price rises
- Higher price → movement along new curve → quantity demanded falls
First is a shift. Second is a movement along.
The Oil Paradox (Supply version)
Story 1: “Hurricane reduces oil supply, prices spike” Story 2: “High prices encouraging more oil production”
Both are true:
- Hurricane (weather) → supply shifts left → price rises
- Higher price → movement along new curve → quantity supplied rises
First is a shift. Second is a movement along.
Explain the forces that drive market price to equilibrium
What is a market?
A market = any situation where buyers and sellers negotiate exchange
Not limited to a physical place
A market exists in any situation (physical place OR electronic medium) in which buyers and sellers negotiate the exchange of goods or services.
Example
- Granville Island Market (physical place)
- Amazon (electronic medium)
- Global oil market (no single location — trades worldwide)
All are markets because buyers and sellers negotiate exchange.
What is a competitive market?
Competitive = no single buyer or seller can influence the price
Requires three conditions
A competitive market has:
- Many buyers — each small relative to the market
- Many sellers — each small relative to the market
- Homogeneous products — identical, no differentiation
| Condition | What It Ensures | Violation Example |
|---|---|---|
| Many small buyers | No buyer can influence price | Provincial gov’t buying prescription drugs (market power) |
| Many small sellers | No seller can influence price | DeBeers controlling diamond supply |
| Homogeneous product | Single market price exists | iPhones vs Android (differentiated products) |
When does the supply-demand model apply?
Only when ALL THREE conditions are met.
Works for: apples, wheat, oil, steel, copper, lumber, foreign currency
Does NOT work for: smartphones, cars, branded clothing, fast food (differentiated products, market power)
What is market equilibrium?
Equilibrium = price where quantity demanded equals quantity supplied
The equilibrium price (or market-clearing price) is the price at which the quantity consumers want to buy exactly equals the quantity producers want to sell. At this price, the market “clears” — no shortages, no surpluses.
The equilibrium quantity is the amount actually bought and sold at the equilibrium price.
left=0; right=100; bottom=0; top=7;
---
y = 6 - 0.05x | blue | label: Demand
y = 1 + 0.04x | red | label: Supply
(55.56, 3.22) | label: Equilibrium
What is disequilibrium?
Disequilibrium = any price where Q_d ≠ Q_s
Market is NOT in balance — price will change
A disequilibrium price is any price where quantity demanded does not equal quantity supplied.
| Term | Definition |
|---|---|
| Excess demand (shortage) | Q_d > Q_s — more buyers than goods available |
| Excess supply (surplus) | Q_s > Q_d — more goods than buyers want |
| Disequilibrium | Either shortage or surplus exists — price will change |
What forces drive market equilibrium?
Shortages push price UP; Surpluses push price DOWN
These forces automatically move the market toward equilibrium
When price is BELOW equilibrium: Shortage
| What Happens | Why | Result |
|---|---|---|
| Quantity demanded > Quantity supplied | Low price attracts buyers, discourages sellers | Shortage (excess demand) |
| Buyers compete for scarce goods | Some willing to pay more | Price gets bid UP |
| Price rises toward equilibrium | Shortage shrinks | Market moves toward balance |
Concert tickets priced too low
- Face value: $50 (below equilibrium)
- Everyone wants tickets, but limited supply
- Shortage → scalpers emerge → actual price rises toward equilibrium
When price is ABOVE equilibrium: Surplus
| What Happens | Why | Result |
|---|---|---|
| Quantity supplied > Quantity demanded | High price attracts sellers, discourages buyers | Surplus (excess supply) |
| Sellers compete for scarce buyers | Some willing to cut prices | Price gets pushed DOWN |
| Price falls toward equilibrium | Surplus shrinks | Market moves toward balance |
Unsold inventory piling up
- Store prices winter coats at $300 (above equilibrium)
- Coats sit on racks unsold
- Surplus → store runs sales → price falls toward equilibrium
Summary of equilibrium forces
| Situation | Price vs. Equilibrium | Force | Direction |
|---|---|---|---|
| Shortage | Price too LOW | Buyers bid up | Price ↑ |
| Surplus | Price too HIGH | Sellers cut prices | Price ↓ |
| Equilibrium | Price just right | No pressure | Price stable |
What is the difference between absolute and relative price?
Absolute price = the price tag
Relative price = one price tag compared to another
Demand and supply respond to RELATIVE prices
| Term | What It Is | Example |
|---|---|---|
| Absolute price (money price) | Dollar amount on the tag | Carrots: $3 per bag |
| Relative price | Ratio of one price to another | Carrots cost 1.5× what broccoli costs |
Why this matters
Scenario Absolute Price of Carrots Relative Price of Carrots Consumer Response Carrots 3, other veg unchanged ↑ 50% ↑ (carrots now expensive vs. alternatives) Substitute away from carrots Carrots 3, ALL veg up 50% ↑ 50% Unchanged (same ratio) No substitution between vegetables Same absolute price increase. Only the first changes relative price — and that’s what triggers substitution.
When economists say "price rises," they mean RELATIVE to other goods
If inflation hits all goods equally:
- Relative prices unchanged → no substitution between goods
- BUT real income falls → income effect kicks in → possible shift toward inferior goods
What is comparative statics?
Comparing two equilibria — before and after a change — ignoring the path between them
Comparative statics is the method economists use to analyze how equilibrium changes:
- Start at equilibrium (before)
- Change ONE exogenous variable (a shifter)
- Find the new equilibrium (after)
- Compare: What happened to price and quantity?
| Term | Meaning |
|---|---|
| Static | A snapshot — a state of rest |
| Comparative | Comparing two snapshots |
| Dynamic (the alternative) | Tracking the adjustment path over time |
Example
Drought destroys wheat crop → supply shifts left.
Comparative statics: Old equilibrium P=8, Q=70. Done.
Dynamic analysis: Day 1 shortage, Day 2 price rises to $6, Day 3 some buyers exit… [tracks the full path]
What are the limitations of comparative statics?
Tells you DIRECTION, not magnitude, timing, or distribution
First tool, not only tool
Comparative statics answers: “Which way does price/quantity move?”
It does NOT answer:
- How much? (magnitude)
- How fast? (timing)
- Who wins, who loses? (distribution)
- What happens during adjustment? (transition costs)
- Does the model even apply? (scope)
The Seven Lenses for Decomposing Claims expose exactly what comparative statics hides
See Seven Lenses Reveal What Comparative Statics Hides for the full mapping.
Good policy requires layering on what comparative statics ignores. Directional analysis is the foundation, not the complete answer.
How is the equilibrium price affected by shifts in the supply and demand curves?
Shift a curve → equilibrium moves → new price AND new quantity
Demand shifts
| Demand Shift | Effect on Equilibrium Price | Effect on Equilibrium Quantity |
|---|---|---|
| Demand increases (right) | Price ↑ | Quantity ↑ |
| Demand decreases (left) | Price ↓ | Quantity ↓ |
Demand increases
Population growth → demand for housing shifts right
- At old price: shortage (more buyers than sellers)
- Shortage → price bid up → movement along supply curve
- New equilibrium: higher price, higher quantity
Supply shifts
| Supply Shift | Effect on Equilibrium Price | Effect on Equilibrium Quantity |
|---|---|---|
| Supply increases (right) | Price ↓ | Quantity ↑ |
| Supply decreases (left) | Price ↑ | Quantity ↓ |
Supply decreases
Drought destroys wheat crop → supply shifts left
- At old price: shortage (more buyers than available wheat)
- Shortage → price bid up → movement along demand curve
- New equilibrium: higher price, lower quantity
Summary table
| Shift | Price | Quantity |
|---|---|---|
| Demand ↑ | ↑ | ↑ |
| Demand ↓ | ↓ | ↓ |
| Supply ↑ | ↓ | ↑ |
| Supply ↓ | ↑ | ↓ |
Notice the pattern
- Demand shifts: Price and quantity move the SAME direction
- Supply shifts: Price and quantity move OPPOSITE directions
What if BOTH curves shift?
One effect is certain, one is ambiguous — depends on which shift is bigger
| Both Shift | Price Effect | Quantity Effect |
|---|---|---|
| Demand ↑ AND Supply ↑ | Ambiguous (depends on magnitude) | Definitely ↑ |
| Demand ↑ AND Supply ↓ | Definitely ↑ | Ambiguous |
| Demand ↓ AND Supply ↑ | Definitely ↓ | Ambiguous |
| Demand ↓ AND Supply ↓ | Ambiguous | Definitely ↓ |
COVID-19 restaurant market
- Demand ↓ (people isolating at home)
- Supply ↓ (restaurants closed, staff unavailable)
- Both shifted left → quantity definitely ↓
- Price effect? Ambiguous — depended on which shift was larger